Smart Plant System
Automated plant management system
Jan 2023 - May 2023
Skills: Javascript • Python • Raspberry Pi • Cyber Physical Systems • IoT • Tinkering
Coursework Project
23 min read
This is a word-for-word copy of the original blog, which is being hosted on medium.
The medium article can be read here.
Bringing green technology right to your doorsteps!
Team 4: Jian Lin, Gadman, Yi Xin, and Kok Wee
Despite the growing interest in home gardening especially due to the pandemic, many Singaporeans face challenges in successfully growing domestic plants. The unpredictable weather and the lack of time to care for plants pose significant obstacles to plant growth, resulting in frequent plant failures and discouraging many potential gardeners. Therefore, it is crucial to address this issue and identify potential solutions to promote and enhance the culture of home gardening in Singapore.

A cyber-physical system that monitors and water/fertilizes plants to reduce the effort required to care for plants while increasing care quality.
We wanted to create this smart plant system because it serves as a full-fledged solution to our problem at hand. The advantages of using sensors and actuators can be fully utilized in this system. Sensors can take measurement data of the plant environment and this data can be meaningfully processed by our backend server for data analysis or automation. Actuators such as pumps can create a closed-loop system with sensors to make the system autonomous, reducing the effort to manually care for the plants.

Circuit Diagram
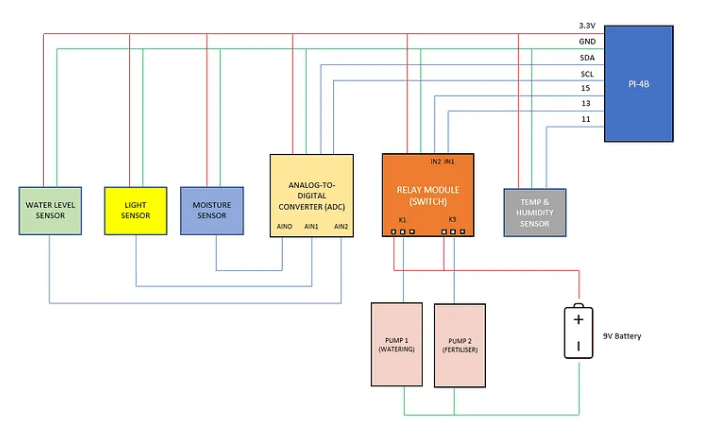
Sensor
- 1 x Soil Moisture Sensor (3.3–5V, Analog) — Measure soil moisture via 2 capacitive probes. Data received is used by the backend server to run automated and live data displays.
- 1 x Light Sensor (3.3–5V, Analog) — Measure light luminance. Data received is displayed on the web application to inform the plant owners of the sunlight coverage of the plant setup.
- 1 x Water Level Sensor (3.3–5V, Analog) — Measure the water level of the water reservoir to supply water dispensing. Data received is used by the backend server to send notifications and validate minimum dispense level, and live data display.
- 1 x Temperature & Humidity Sensor (3.5–5.5V, Digital, DHT11) — Measure the temperature and humidity sensor. Data is used for live data display.
Actuator
- 2x Water Pump (6V, 30ml/s) — Perform dispensing functions.
- 1x Relay Module (3.3–5V, 4-Channel) — Isolate the circuits for the pumps to protect the microcontroller in the event of a short circuit or current overload.
Microcontroller
- 1 x Analog-To-Digital Converter (3.3–6V, PCF8591T Chip) — Convert the analog signals from the sensors into digital ones so that the digital pins for the microcontroller (Raspberry Pi) can read the data.
- 1 x Raspberry PI 4B
Power Source
- 1 x Battery (9V)
Storage
- 1x Micro SD Card (32GB)
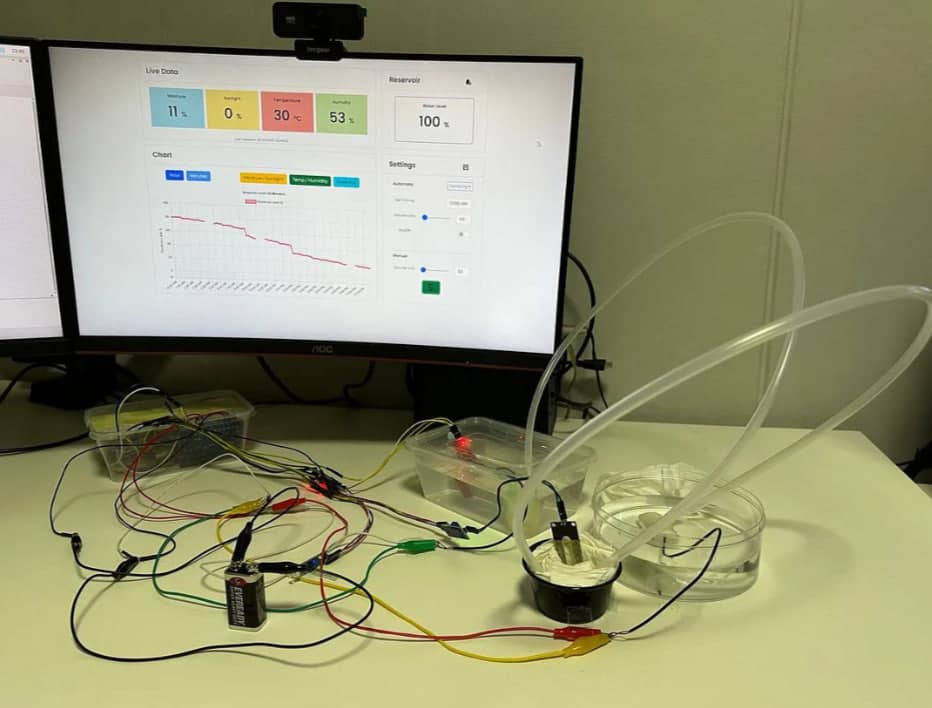
The link for the demonstration can be found here.
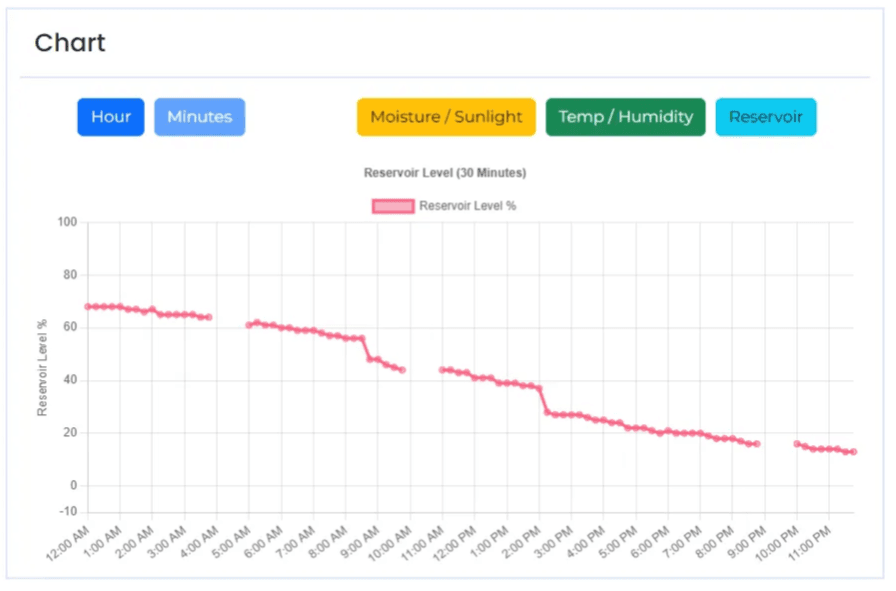
The first feature of our prototype is the monitoring system. Like most cyber-physical systems, our system’s ability to measure environmental data is critical to its capabilities. Our system monitors 3 data points — Soil Moisture Level, Sunlight Level, and Reservoir Water Level. Besides sending these data points to the web application as live data — every 3 seconds, these data points are logged every 1 minute into the database. The reason for these time intervals is due to the lead time of sensor measurement, and the flexibility to adjust chart data granularity respectively.
Backend Software Implementation (Data Logging)
First, we declare the libraries needed set up GPIO, and receive ADC and sensor data.
import RPi.GPIO as GPIO
import smbus
import Adafruit_DHT
Next, we declare the Raspberry Pi’s I2C address.
# declare raspberry pi i2c address
address = 0x48
We then declare the following:
- Type of Adafruit sensor used
- GPIO mode
- GPIO pin for DHT
- SQLite3 Database Name
- Logging Frequency
# declare sensor type
DHT_sensor = Adafruit_DHT.DHT11
# declare GPIO mode
GPIO.setmode(GPIO.BOARD)
DHT = 17
# declare DB name
dbname='sensors_data.db'
# declare logging frequency
logging_frequency = 1*60
The following function receives the different input data from the digital and analog sensors. For digital sensors, input data be read directly from the built-in Adafruit function by inputting the sensor type and the GPIO pin number. On the other hand, analog sensors require the smbus library to receive data from the ADC. The bus channel is reset every time sensor data is read to reduce errors caused by the smbus channel overloading.
def getData():
  # get humidity and temperature data from digital sensor
  humidity, temperature = Adafruit_DHT.read_retry(DHT_sensor, DHT)
  # get reservoir level from analog sensor
  bus = smbus.SMBus(1)
  reservoir = bus.read_byte_data(address,0)
  bus.close()
  # get soil moisture level from analog sensor
  bus = smbus.SMBus(1)
  moisture = bus.read_byte_data(address,1)
  bus.close()
  # get lighting level from analog sensor
  bus = smbus.SMBus(1)
  sunlight = bus.read_byte_data(address,2)
  bus.close()
  return moisture,temperature,humidity,sunlight,reservoir
This function logs data into an SQLite3 database. Raw data is saved to the database and is processed/formatted later in the web application. This makes it easier to configure the operating range of the sensors since they differ slightly from every bootup.
def logData(moisture,temperature,humidity,sunlight,reservoir):
  dt = datetime.today().strftime('%d-%m-%Y %H:%M:%S')
  conn=sqlite3.connect(dbname)
  curs=conn.cursor()
  curs.execute("INSERT INTO sensors_data (timestamp,moisture,temperature,humidity,sunlight,reservoir) VALUES ((?), (?), (?), (?), (?), (?))", (dt,moisture,temperature,humidity,sunlight,reservoir))
  conn.commit()
  conn.close()
The following is a running server function to log data based on the logging frequency and to call the validation API for automatic functions. We wanted to reduce the complexity of having a separate running function for the validation API calls. Thus, given that the time interval for these two functions is the same, we decided to couple them together.
On this note, we found some issues with the smbus implementation, where one of the analog data (reservoir water level) tends to overwrite the other analog data. We figured that it is likely due to the memory overflow of the smbus channel. Thus, we created a while loop to keep retrieving input data until a valid one is found.
try:

  while True:
    moisture,temperature,humidity,sunlight,reservoir = getData()
    # workaround smbus issue where reservoir data will overwrite the rest
    while (reservoir == moisture or reservoir == sunlight):
      moisture,temperature,humidity,sunlight,reservoir = getData()
    logData(moisture,temperature,humidity,sunlight,reservoir)

    response_watering = requests.post(url='http://' + ip_address + ':8087/auto_water_plant',data=json.dumps({'moisture': moisture, 'reservoir': reservoir}))
    result_watering = response_watering.json()

    response_fertilising = requests.post(url='http://' + ip_address + ':8087/auto_fertiliser')
    result_fertilising  = response_fertilising.json()

    response_notification = requests.post(url='http://' + ip_address + ':8087/send_notification',data=json.dumps({'reservoir': reservoir}))
    result_notification  = response_notification.json()

    time.sleep(logging_frequency)

finally:

  GPIO.cleanup()
Backend Software Implementation (Live Data)
First, we make the necessary declarations which are the same as the ones from the Data Logging implementation above.
Next, we create a function that receives the different input data from the digital and analog sensors. The main difference between this function and the get_data() function in Data Logging is the extra code e.g., timestamp and converting of an object to JSON format.
def get_live_data():
  # get humidity and temperature data from digital sensor
  humidity, temperature = Adafruit_DHT.read_retry(DHT_sensor, DHT)
  # get reservoir level from analog sensor
  reservoir = bus.read_byte_data(address,0)
  # get moisture level from analog sensor
  moisture = bus.read_byte_data(address,1)
  # get sunlight level from analog sensor
  sunlight = bus.read_byte_data(address,2)
  time = datetime.today().strftime('%d-%m-%Y %H:%M:%S')
  return json.dumps({
      'time': time,
      'moisture': moisture,
      'temperature': temperature,
      'humidity': humidity,
      'sunlight': sunlight,
      'reservoir': reservoir
  })
To create a channel for live data communications, we used the web sockets framework as this allows for duplex communications with lower overhead and faster communication. We used the socket functions from the flask_socketio library to establish a web socket connection with the web application.
from flask_socketio import SocketIO, emit

@socketio.on('connect')
def connected():
  print("Connected to client..")
  emit("connect",{'data': "Server is connected"},broadcast=True)

@socketio.on('disconnect')
def disconnected():
  print("Client is disconnected")
  emit("disconnect",{'data':"Server is disconnected"},broadcast=True)

@socketio.on('live_data')
def live_data_request(count):
  emit("live_data",{'data': get_live_data()}, broadcast=True)
  print(str(count),"- Sent data to client..")

@socketio.on('request')
def handle_client():
  emit("data",{'data':"request received"}, broadcast=True)
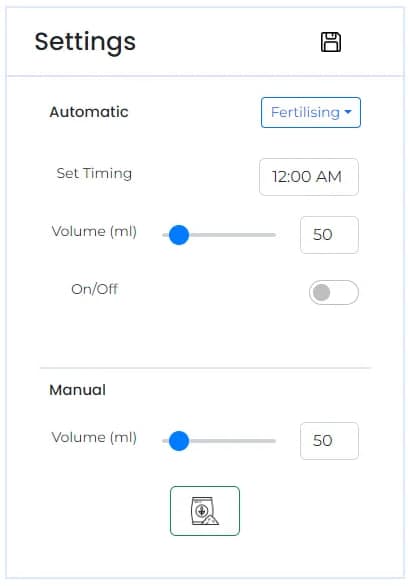
In our prototype, we have two automated system functions — watering and fertilizing. Automatic watering works as a closed-loop and event-based system where soil moisture is measured periodically and compared to the configured data stored in the database. If the conditions are met, the dispensing function is triggered and water is dispensed. On the other hand, automated fertilizing works as an opened-loop and time-based system where the water pump is powered based on the current time compared to the configured data stored in the database.
Backend Software Implementation (APIs)
First, we make the necessary declarations which are the same as the ones from the Data Logging implementation above.
Next, we set up the GPIO outputs for the water pump.
# declare GPIO mode
GPIO.setmode(GPIO.BOARD)
# declare pin GPIO
water_pump = 13
fertiliser_pump = 15
# setup GPIO type
GPIO.setup(water_pump, GPIO.OUT)
GPIO.setup(fertiliser_pump, GPIO.OUT)
GPIO.output(water_pump, GPIO.HIGH)
GPIO.output(fertiliser_pump, GPIO.HIGH)
We then create the following API functions to process data and control the water pumps.
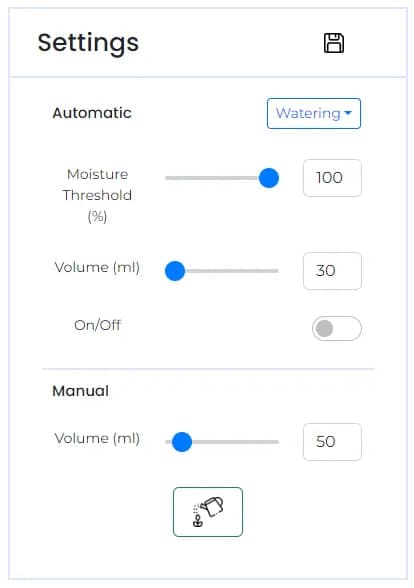
The following API function reads the automatic watering configuration data from the database and compares them with the sensor data received from the Data Logging running function. From the configuration data, if auto (function toggle) is true and current moisture data is below moisture threshold data, output signals are sent to the pump until the target volume is reached. This volume is derived from the duration data from and the operational data of the water pump — 30ml/s
# execute auto watering
@app.route('/auto_water_plant',methods=['POST'])
def auto_water_plant():
  data = json.loads(request.data)
  moisture = data['moisture']
  reservoir = data['reservoir']

  conn = sqlite3.connect('watering.db')
  curs = conn.cursor()
  r = curs.execute("SELECT * FROM watering ORDER BY id DESC LIMIT 1")
  db_data = r.fetchall()
  threshold = moisture_analog_dry-(moisture_analog_dry-moisture_analog_wet)*(db_data[0][1]/100)
  duration = db_data[0][2]
  auto = db_data[0][3]

  try:
    if (moisture > threshold and auto == 1):

      GPIO.output(water_pump, GPIO.LOW)
      time.sleep(duration)
      GPIO.output(water_pump, GPIO.HIGH)

      return json.dumps({"status": 200, "data":"Auto watering successful."})
    else:
      return json.dumps({"status": 400, "data":"Auto watering switched off or moisture level sufficient."})
  except:
    return json.dumps({"status": 400, "data":"Error with auto watering. Please try again later."})
The following API function is called directly from the web application and output signals are sent to the pump until the target volume is reached. Unlike automated watering where the duration data is retrieved from the database, the duration data here is received from the API request.
@app.route('/manual_water_plant',methods=['POST'])
def manual_water_plant():
  data = json.loads(request.data)
  duration = data['duration']

  try:
    GPIO.output(water_pump, GPIO.LOW)
    time.sleep(duration)
    GPIO.output(water_pump, GPIO.HIGH)
    return jsonify({"status": 200, "data": "Manual watering successful."})
  except:
    return jsonify({"status": 400, "data": "Error with manual watering. Please try again later."})
The following API function updates the automatic watering configuration data in the database based on the data received from the API request, which is sent from the web application.
# update auto watering
@app.route('/update_auto_watering',methods=['PUT'])
def update_watering():
  data = json.loads(request.data)
  threshold = data['threshold']
  duration = data['duration']
  auto = data['auto']

  conn = sqlite3.connect('watering.db')
  curs = conn.cursor()
  curs.execute("INSERT INTO watering (threshold,duration,auto) VALUES ((?), (?), (?))", (threshold,duration,auto))
  conn.commit()
  r = curs.execute("SELECT * FROM watering")
  db_data = r.fetchall()
  conn.close()

  return json.dumps({"status": 200, "data": "Auto watering updated successfully."}):"Error with auto watering. Please try again later."})
Note: The automatic fertilizing API function is similar to the automated watering API function. The only difference is the compared variable (time vs moisture threshold)
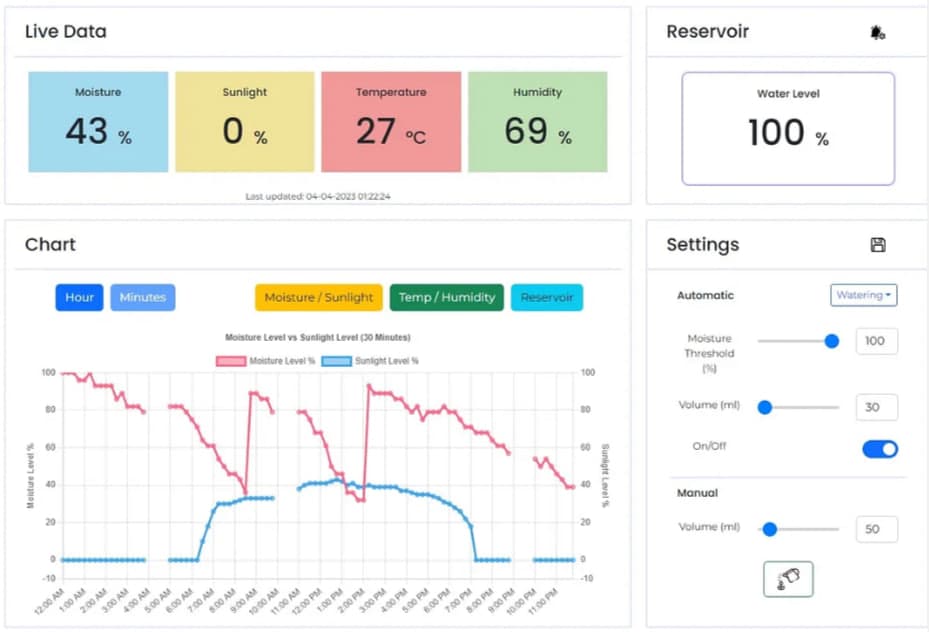
Our prototype features a web application to interface with the backend server and to provide the plant owner with a simple yet comprehensive UI. The application is built with React framework with a ChartJS library plugin. There are 4 main sections in our web application.
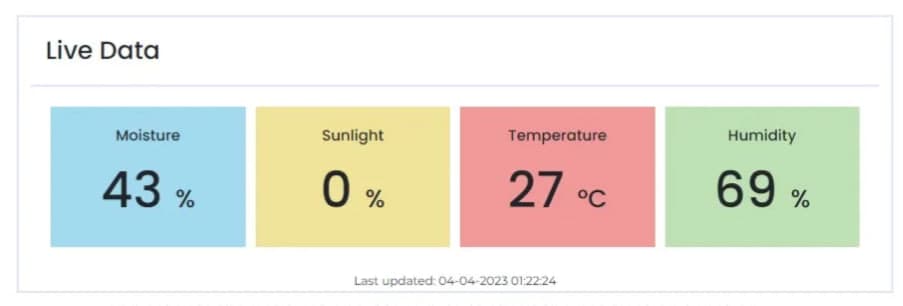
Firstly, there is the live data section. This section displays the current sensor data. Data is retrieved and displayed from the backend server every 3 seconds. There could be delays and re-retrievals if the data received is invalid. The reason for this 3 seconds is to create some buffer given the lead time needed to measure sensor data (as mentioned previously).
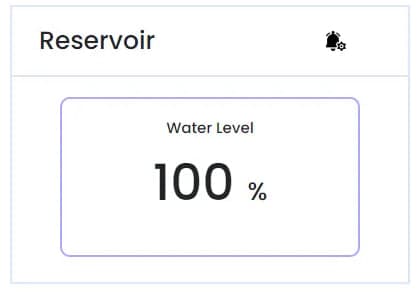
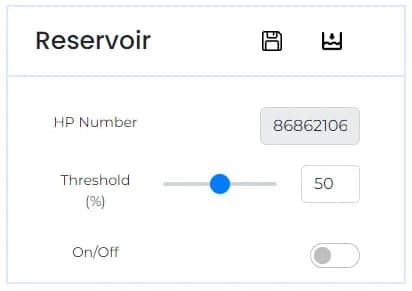
Secondly, there is the reservoir data section. This section has two views — reservoir water level data and notification settings. The water level data shows the live water level in the reservoir while the notification settings show the configuration for the reservoir notifications. In the notification settings view, plant owner can set their phone number, water level threshold and activate the notifications. More details about the notification function will be covered in the portability feature.
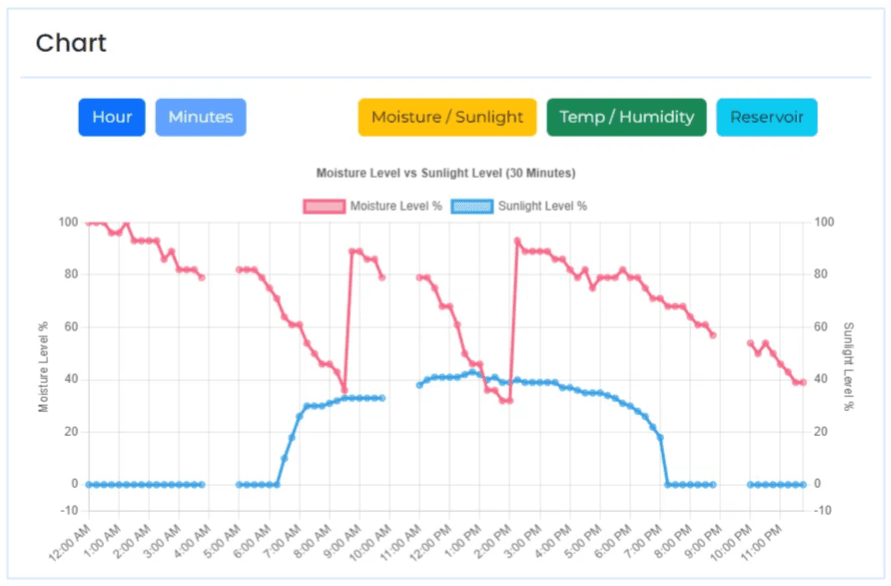
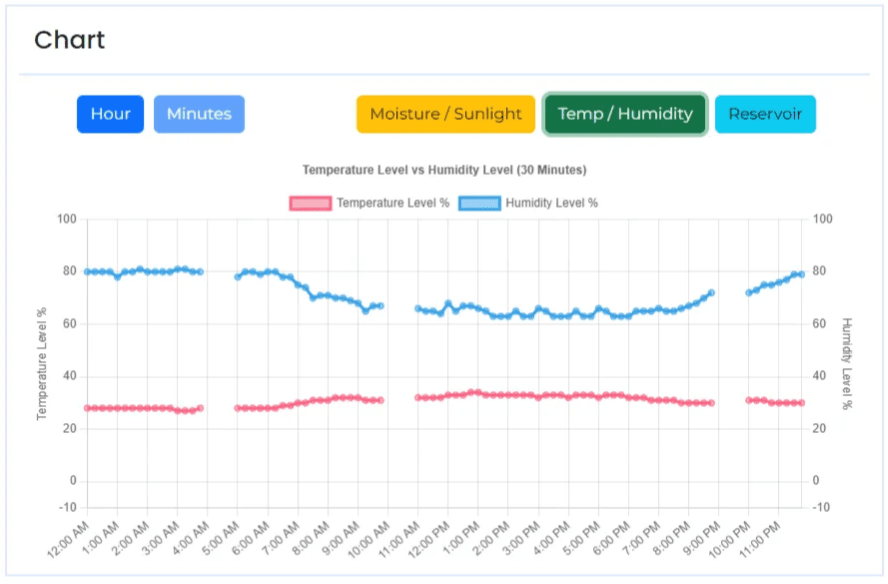
Thirdly, there is the chart data section. This section displays a dual y-axis line chart that allows the plant owner to switch between chart granularity and sensor variable combinations e.g., moisture/sunlight, temperature/humidity, etc. The reason for a dual y-axis line chart instead of a normal single y-axis line chart is to simplify the UI for a better user experience and to present some correlation in the chart data since the combinations are related.
Lastly, there is the settings section, which allows plant owners to set automated watering and dispensing configurations, and manually dispense water/fertilizer. The settings are saved to the SQLite3 database which will be queried by the backend server. (Refer to Feature 2 — Automated)
Web Application Software Implementation (Chart)
We first create labels for the y-axis.
const generateLabels = () => {
  const items = [];
  new Array(24).fill().forEach((acc, index) => {
    items.push(moment({ hour: index }).format('h:mm A'));
    items.push(moment({ hour: index, minute: 15 }).format('h:mm A'));
    items.push(moment({ hour: index, minute: 30 }).format('h:mm A'));
    items.push(moment({ hour: index, minute: 45 }).format('h:mm A'));
  })
  return items;
  }
Next, we create a list of filled timestamps.
const generateMinutes = () => {
  const list = []
  new Array(24).fill().forEach((acc, index) => {
    list.push(moment({ hour: index }).format('H:mm'));
    list.push(moment({ hour: index, minute: 15 }).format('H:mm'));
    list.push(moment({ hour: index, minute: 30 }).format('H:mm'));
    list.push(moment({ hour: index, minute: 45 }).format('H:mm'));
  })
  setMinutes(list)
}
Before we input the data into ChartJS functions, we need to first process the data received from the backend server. An important step in this processing is to match each row of data from the database by its timestamp, to the list of filled timestamps above. This is to align the data to its respective measured time. Next, we push this data into the chart, depending on whatever sensor variable combination was toggled.
const processData = (data) => {
  const reversedData = data.reverse()
  const moisture = [];
  const sunlight = [];
  const temperature = [];
  const humidity = [];
  const reservoir = [];

  const today = moment().format('DD-MM-YYYY');
  minutes.map((min) => {
    var minHour = min.split(":")[0]
    if (minHour < 10) {
      minHour = `0${minHour}`
    }
    var minMinute = min.split(":")[1]
    const filtered = reversedData.filter((item) => {
      const date = item[1].split(" ")[0]
      const minute = item[1].split(" ")[1].split(":")[1]
      const hour = item[1].split(" ")[1].split(":")[0]
      return hour == minHour && minute == minMinute && date == today
    })

    if (filtered.length > 0) {
      if (type == 'MS') {
        moisture.push(MoistureFormat(JSON.parse(filtered[0][2])));
        sunlight.push(SunlightFormat(JSON.parse(filtered[0][5])));
      }
      else if (type == 'TH') {
        temperature.push(JSON.parse(filtered[0][3]));
        humidity.push(JSON.parse(filtered[0][4]));
      }
      else {
        reservoir.push(ReservoirFormat(JSON.parse(filtered[0][6])));
      }
    }
    else {
      if (type == 'MS') {
        moisture.push(null);
        sunlight.push(null);
      }
      else if (type == 'TH') {
        temperature.push(null);
        humidity.push(null);
      }
      else {
        reservoir.push(null);
      }
    }
  })
  if (type == 'MS') {
    setMoisture(moisture);
    setSunlight(sunlight);
  }
  else if (type == 'TH') {
    setTemperature(temperature);
    setHumidity(humidity);
  }
  else {
    setReservoir(reservoir);
  }
}
Web Application Software Implementation (Data Calibration and Formatting)
To account for sensor calibration and data formatting, we created boundary variables that can be updated whenever we detect a change in the operational boundaries of the sensors. We also integrated this with data formatting, which involves converting the 8-bit or 256 bytes analog data into an intuitive range (1–100%)
// operational ranges
const sunlight_analog_min = 255
const sunlight_analog_max = 6

const moisture_analog_dry = 240
const moisture_analog_damp = 200
const moisture_analog_wet = 212
const moisture_reference = moisture_analog_dry - (moisture_analog_dry - moisture_analog_wet)/4

const reservoir_analog_full = 147
const reservoir_analog_min = 10

export function SunlightFormat(input) {
  // out of boundary data
  if (input < 6) {
      input = 255
  }
  else if (input > 230) {
      input = 255
  }
  var output = (Math.abs(input - sunlight_analog_min)) / (sunlight_analog_min-sunlight_analog_max)
  // out of boundary data
  if (output > 1) {
      output = 1
  }
  return (output * 100).toFixed(0);
}
export function MoistureFormat(input) {
  // out of boundary data
  if (input > moisture_analog_dry) {
      return 0;
  }
  var output = (moisture_analog_dry - input) / (moisture_analog_dry-moisture_analog_wet)
  // out of boundary data
  if (output > 1) {
      output = 1
  }
  if (output < 0) {
      output = 0
  }
  return (output * 100).toFixed(0);
}

export function MoistureFormat2(input) {
  var output = (moisture_analog_dry-moisture_analog_wet)*(input / 100)

  return (moisture_analog_dry - output)
}

export function ReservoirFormat(input) {
  // out of boundary data
  if (input < reservoir_analog_min) {
      return 0;
  }
  else if (input >= reservoir_analog_full) {
      return 100;
  }
  else {
      return ((input/(reservoir_analog_full)) * 100).toFixed(0);
  }
}

export function ReservoirFormat2(input) {
  return input/100*(reservoir_analog_full)
}
The last feature we have for our prototype is its portability. To make setup easier and quicker, we designed the system with a reservoir to provide a water supply to the water dispenser, instead of using a fixed water supply. This allows the entire system to be portable. Thus, plant owners will have the flexibility to shift the system setup to their liking or move the plants to an area with more sunlight coverage, based on a sunlight data analysis.
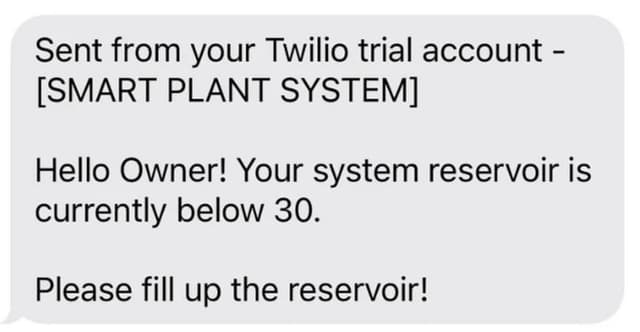
To ensure our reservoir does not empty out, we implemented a notification system with Twilio. When the notification settings are saved in the web application, the data is stored in the database. Every time the backend server runs the Data Logging function, it calls the notification API which will compare the current reservoir water level and the threshold level stored in the database. If the current water level is lower, then it will send a request to the Twilio server, which will send an SMS to the phone number which is based on the data from the database.
Autonomy
A 100% autonomous system is something that we thought would be a great and logical extension of our current setup. Currently, one of our key features is portability. If a user decides to forgo this feature to have a completely automated system instead, we want to make that happen by allowing our system to run autonomously by connecting the pump to a water source. This removes the need for any human intervention with the system, apart from the fertilizer reservoir which can last for a long time anyway.
Monitoring
With our current implementation, monitoring could also be optimized. Currently, all of our sensors run through a single bus channel. The implication is that we potentially are not able to increase the fine-graininess of our logging of data due to the limitations of the single bus channel on some of our sensor outputs (overloading). We intend to improve the system’s monitoring capabilities by using a better ADC with larger bus channel bandwidths. Additionally, we also see potential in adding other high-quality sensors to effectively observe and capture the different data states of our system. With a better ADC and higher-quality sensors, the risks of sensor error due to lack of calibration should be mitigated as the sensor data should be more consistent and accurate by default, which increases the system's operational effectiveness.
Scalability
Scalability is also another important factor that we would like to consider. With our current setup, the hardware connections are already relatively independent. However, we see room for improvement where we can further modularise our system to enhance adaptability such as integrating a plug-and-play feature where additional sensors can be added and included in the software as well.
Learning Phases
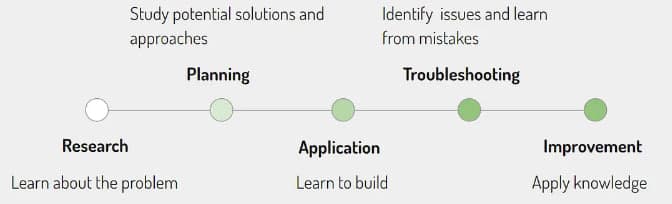
Figure 15 shows the different learning phases that our team went through. Firstly, in the research phase, we started off with brainstorming and learning about the problem we have. Next, in the planning phase, we look at potential solutions and the ways we can approach the problem. We then move on to the application phase, where we learn to build the prototype. After which is the troubleshooting phase, where we identify issues with the prototype and learn while fixing them. Lastly, we reach the improvement phase, where we make our prototype better by using the knowledge learned so far.
Research
The first lesson we learned from this project was to do our research thoroughly. As we embarked on our project, we initially thought that the sensors we bought were a plug-and-play. After we started to put the hardware together and run some code, we realized that the Raspberry Pi’s pins are digital while the sensor’s pins are analog. We had to make a second trip down to Sim Lim Tower to purchase an Analog Digital Converter (ADC) to correctly read the inputs from our sensors.
In the future, we will dive deeper into the parts research before we commit to component procurement so that we will not waste time doing re-procurement. As an additional precaution, we can also check the availability of the component by contacting the electronics vendor first.
Calibration
The second lesson learned is the practice of calibration. As we ran the prototype throughout its development, we realized the sensor data from our sensors were inconsistent and sometimes inaccurate. For example, when we filled the reservoir water level to the max, the reservoir water level sensor gave us different measurements on different occasions, instead of its fixed maximum operating range value. Thus, after some troubleshooting, we realized the need to recalibrate the sensor data every time we boot the system to ensure that the data we get is consistent and accurate. This can be done by testing and declaring the operating boundaries of the sensor e.g., dipping the reservoir water level sensor into a full reservoir and using the data collected as the maximum range value.
Additionally, we also learned to account for invalid readings. There are times when the readings from the ADC are invalid, such as having duplicate readings and showing minimum/maximum readings randomly. Thus, we needed to add conditional code to filter out these invalid data to protect data accuracy.
Problem-Solving
Last but not least, we learned how to problem-solve. It was our first time working with a multifaceted system, which includes the back end, front end, and hardware. Thus, when it comes to troubleshooting, it was challenging to identify faults in the system because problems could be due to the hardware wiring, sensors, backend servers not running properly, or some test code in the frontend web application.
Through this project, we learned to isolate and identify issues by testing each sub-system individually and doing some data flow tracing to find out where the problem lies. Additionally, to mitigate the chances of loose connections and to make hardware troubleshooting easier, we taped the wire joints to secure them and performed cable management for the wires. We also did some labeling so that we can troubleshoot the hardware easily and set up the hardware faster.
Our team felt that this project was an enriching one because it was the first time we worked with hardware components. This meant that we needed to explore and research how the hardware works to provide us with the data we need for the software. It was also interesting to implement concepts of a cyber-physical system, that is, a system of systems in our prototype — The monitoring system, Automated system, and Notification system. Moreover, it was satisfying to see the hardware components function in real life instead of the software components on the screen.
The cyber-physical systems industry has huge potential to grow and advance in the coming years. The team is excited to see what it offers and could possibly play a role in this growth. We would like to extend our gratitude to Professor Thivya Kandappu for her assistance in creating this fruitful project.
Source code: https://github.com/GanJL/cs460-g1t4