Bus Lightyear
To infinity and beyond
Aug 2023 - Dec 2023
Skills: ReactJS • Vite • Tailwind CSS • GORM • OpenAPI • Python • Prometheus • Graphana
Coursework Project
12 min read
This project was done as part of a course in SMU, IS483 Project Experience, also known as the Final Year Project. The sponsor for this project is paymentinapp Inc. (PIAPP), a startup that focus on Mobility-as-a-Service (MaaS), which aims to solve social problems like traffic congestion and environmental issues related to the transportation industry.
Aside from that, they are also a fintech provider, facilitating cross-border transactions. Currently, PIAPP is looking to enhance its MaaS offerings by improving their behind-the-scene algorithms, hence, the partnership with SMU.
The team members and their responsibilities are
- Gan Jian Lin - Frontend Development
- Chew Yi Xin - Frontend Development
- Biondi Lee - Mathematical Model (solver)
- Loh Kok Wee - Backend Development and Data Collection Pipeline
- Calista Lim - ETL Pipelines and Algorithm Research
- Gadman Tang - ETL Pipelines and Algorithm Research
Our final report and presentation file can be accessed below
Public buses are one of the most widely used form of transportation. However, the bus transportation network at the current stage is not efficient enough, resulting in bus bunching, overcrowded buses, and late arrivals.
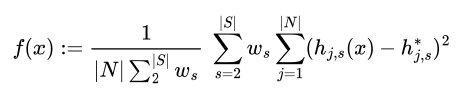
THe team's objective is to optimise bus dispatch through demand analysis and forecasting. Our main goal is to reduce headway, which is the time interval between consecutive buses on the same route or line. In layman terms, it is the duration of time passengers have to wait at a bus stop or station for the next bus to arrive.
For this project, we measure this by calculating the Weighted Headway Deviation, represented by the following formula.
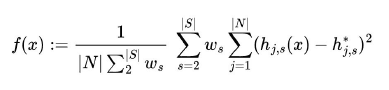
Our objective is for the research-backed model that we come up with can be a universal solution that enables PIAPP's adoption of this solution at scale.
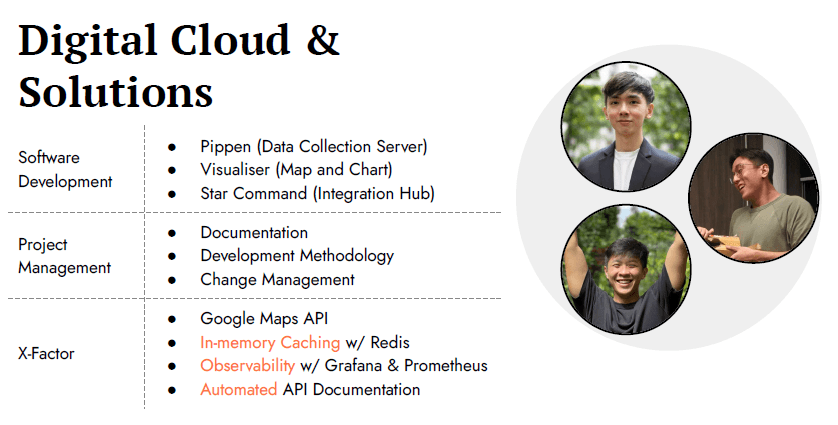
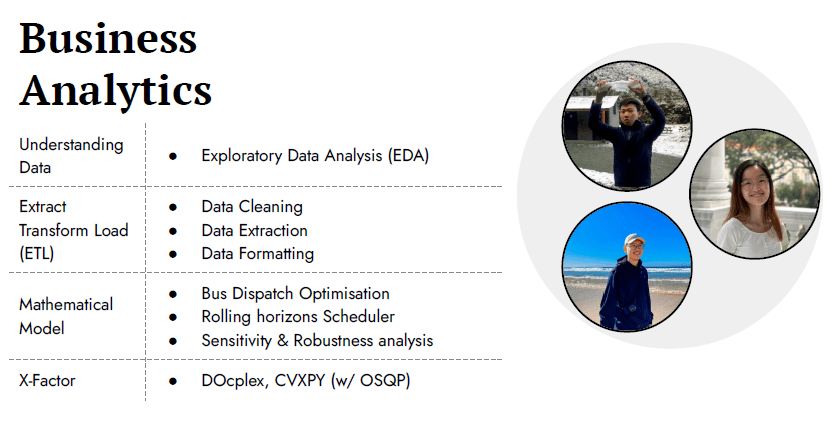
The learning objectives for this project are split between students majoring in Digital Cloud & Solutions (Jian Lin, Kok Wee, and myself) and Business Analytics (Biondi, Calista, and Gadman).
The team embarked on this project using industry-standard Scrum and Agile methodologies, modifying the process to suit the dynamic schedules of the team members, who are all also busy with their separate coursework.
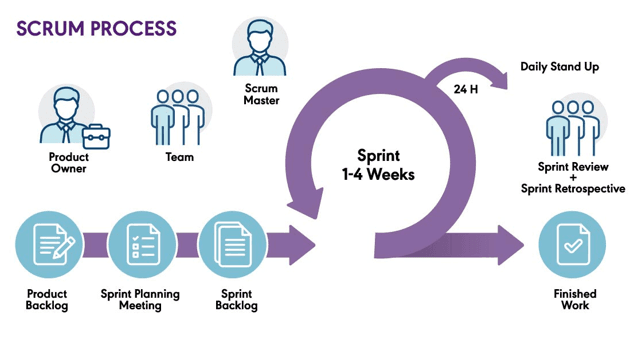
Alongside this, we made use of the following tools to help with our project management.
- JIRA for backlog and timeline management
- Confluence to keep track and manage a central repository of internal documentation and research
- Github for versioning and maintenance of our code repositories
- Postman to build and test APIs
Our solution is made with te intention of allowing PIAPP to obtain optimised bus schedules for transport services they are interested in with the input of General Transit Feed Specification (GTFS) data. With GTFS being the global standard for sharing public transportation information, the solution is made to be largely universal.
The solution mainly comprises of the following
- ETL scripts to transform raw data collected from Pippen into scripted inputs
- Mathematical model that takes in said scripted inputs and computes bus dispatch times
- UI to display the visualisation and performance of the mathematical model
- Star command (our orchestration body) which integrates the above three components together
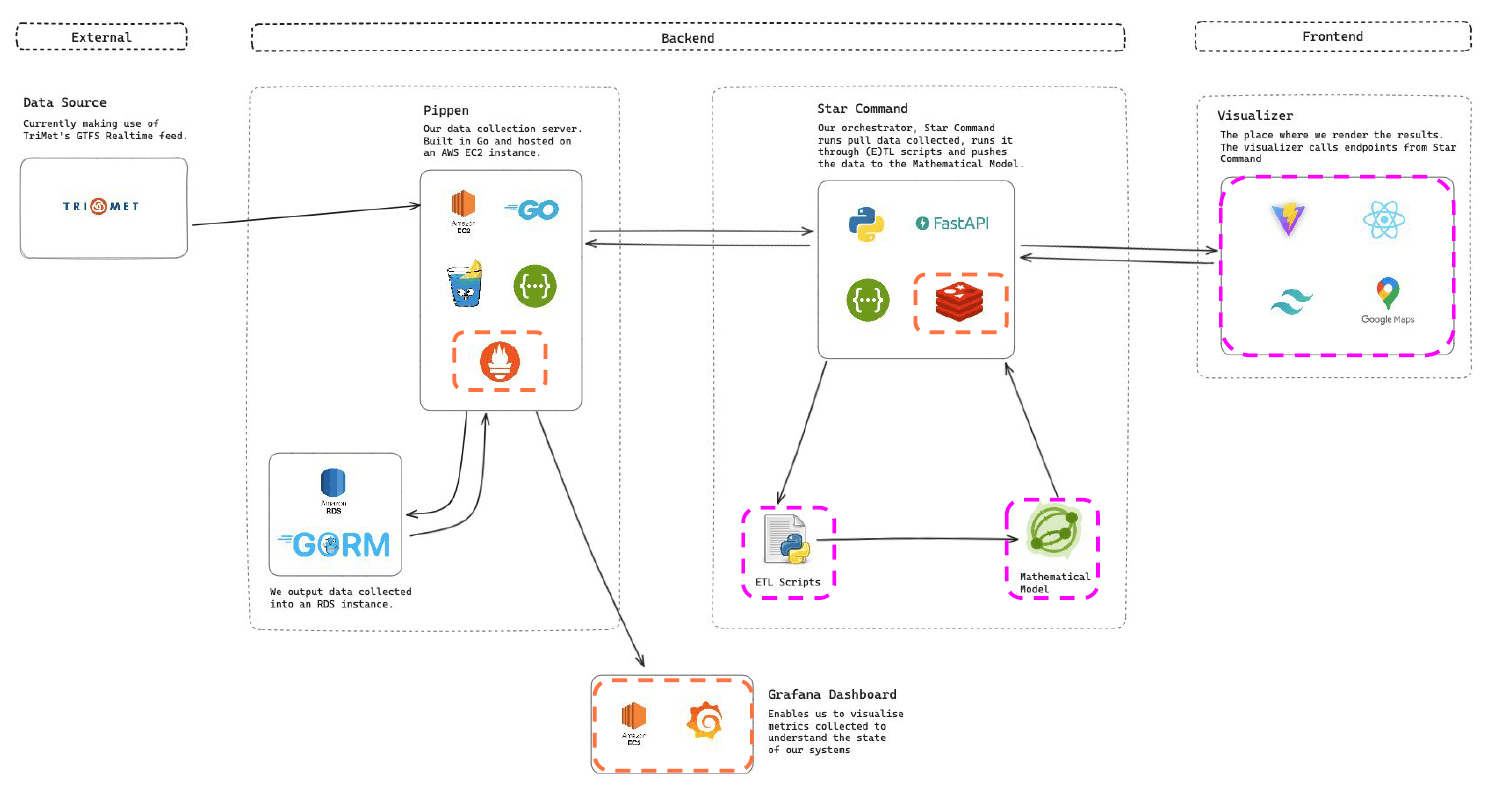
The solution architecture can be broken down into three main components: Star Command, Pippen, and Visualiser.
Star Command development is mainly led by Kok Wee.
Star Command is the server where the integration of the entire project is handled. It enables various project elements to communicate through a shared interface, and most importantly, houses the heartbeat of the project, the Mathematical Model.
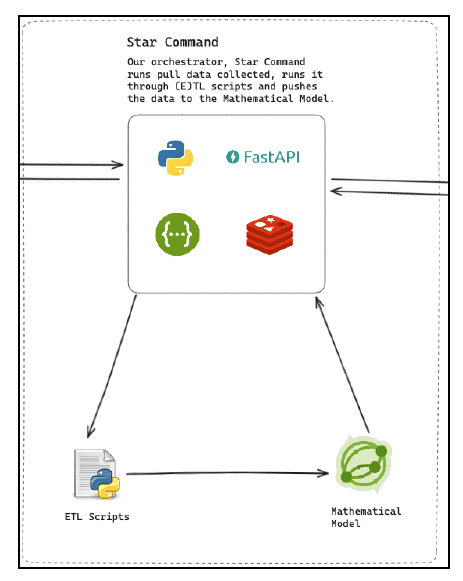
The technologies used for this component of the solution are
- Python which is used in ETL scripts (pandas, numpy) and mathematical model (CVXPY) as it provides strong support for mathematical and data-based libraries
- FastAPI, a Python framework for building RESTful APIs with built-in support for concurrency and strong type support
- Swagger UI, and open-source tool for interacting with and testing RESTful web services with documentation
- Redis for in-memory storage and caching functionalities
Pippen development is mainly led by Kok Wee.
Pippen acts as the data collection server, and is hosted on an AWS EC2 instance. It enables users to collect GTFS Realtime data at different intervals. Data collected can then be retrieved in a .csv file, which then can be used for analysis and 'training' of the mathematical model.
As the project revolves heavily around data, Pippen has been designed with operational uptime in mind. A Continuous Integration (CI) pipeline has been developed to guarentee that Pippen is only deployed without errors. There are also observability frameworks that Pippen interacts with to ensure that Pippen's state can be observed and understood at all times. These safeguards guarentee that Pippen remains operational for data collection.
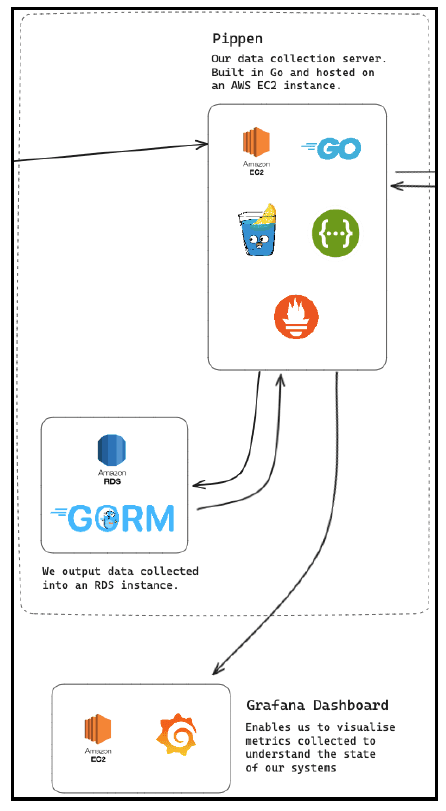
The technologies used for this component of the solution are
- Golang - compiling to binary enables easy development. There is also strong support for concurrency, allowing us to run multiple pollers without affecting performance
- Gin is similar to FastAPI in Star Command. It is a web development framework that increases developer productivity by abstracting rudimentary code and provides a standard structure
- Gorm is an ORM library for Golang, which enables Pippen to interact witha database to store captured data from polling
- Prometheus gathers time series metrics from the poller which can be later visualised with ease on Grafana
- Grafana is where Pippen's observability metrics are rendered. Users can observe the different metrics collected in Prometheus to understand the state of Pippen better
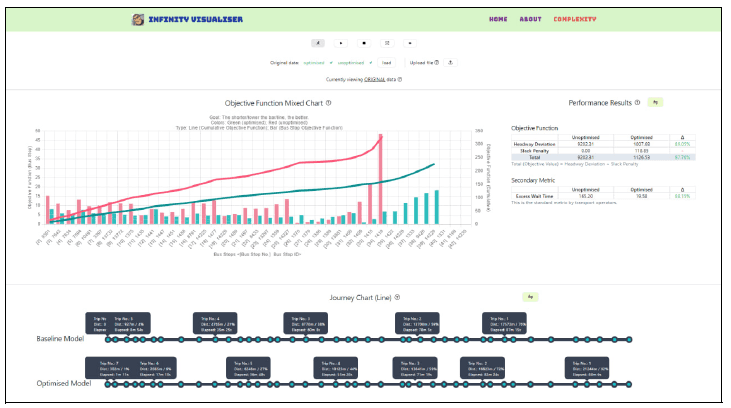
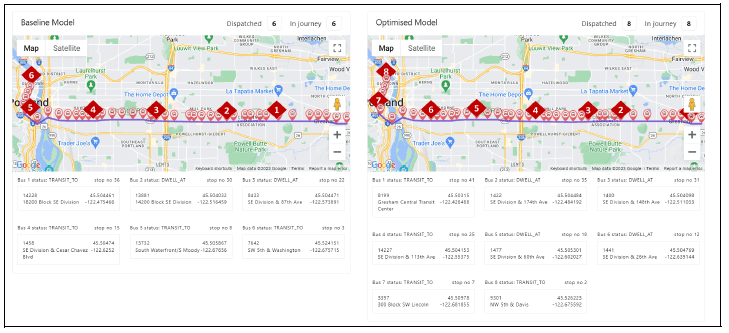
Visualiser development is mainly led by Yi Xin and Jian Lin.
The visualiser comprises of a metrics chart and a journey chart, along with controls for users to interact with the visualisations. It is the main avenue for users to interpret the end results with ease. There are also features which allows business users to interact with the Mathematical Model through the UI without having to tinker with the code base.
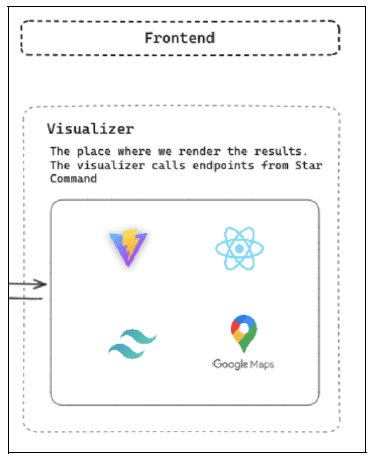
The technologies used for this component of the solution are
- Vite, our development server and build tool of choice that supports faster web app build times
- ReactJS, a web application framework that is chosen for its reliability, familiarity and flexibility, to speed up development time
- CSS and Tailwind CSS - allows predefined styles to prevent clutter and enable developer efficiency, while also allowing for custom styling
- Google Maps API - maps layer to render map visualisation
- Chart JS - visualisation of simulation performance
- Papaparse - processing of large (>100k rows) CSV data files retrieved from the server
This portion of the project is mainly led by Gadman and Calista.
For this project, both GTFS static (GTFS-S) and GTFS realtime (GTFS-R) data were utilised. The former provides us information of planned services and the latter provides us information about the actual services. These data were collected via Pippen.
GTFS-S provides basic information that does not change frequently, such as routes, stops and frequencies. These static data are updated occasionally when schedules change. Comparatively, GTFS-R provides real-time updates on the actual vehicle’s location, providing us with timestamps that indicate their arrival and departure estimates.
Unfortunately, we were unable to work with LTA to obtain public transportation data that conforms with GTFS. With this in mind, GTFS data was used to extract out actual trip information to generate a JSON file input for the mathematical model. In particular, focusing on the bus service FX2 located in Portland, Oregon.
This portion of the project is mainly led by Biondi.
The mathematical environment for this project was modelled with quadratic programming, commonly used for mathematical optimisation problems. The model was adapted from K. Gkiotsalitis and E.C. van Berkum (2020), specifically mathematical formulation 𝑄.
The objective of the model is to minimise the variances between the actual and target headways by assigning optimal dispatch offsets in given dispatch schedules.
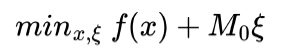
A slack penalty will also be introduced if the predefined maximum allowed deviation (also known as ‘slack’) is breached, which indicates how much the last trip can deviate from the original schedule. This deviation will ensure that the optimised final trip does not deviate too much from the original operating hours. The objective function used for the model is as follows:
To ensure convexity, several assumptions and constraints were made to ensure a feasible solution was given:
- Passenger arrivals at stops are random. This behaviour is supported by Welding (1957, 1985) and Bartholdi and Eisenstein (2012), noting that independent passengers do not coordinate their arrivals with the arrival times of buses in the case of more than 5 buses per hour.
- Buses are not allowed to overtake in the mathematical space.
- Passengers do not leave the bus stops once they arrive and start their wait for their buses.
- Traffic conditions are deterministic and buses will take the same time, all the time .
- All buses are able to accommodate all passengers without any capacity constraints. By extension, this will also mean that there are no stranded passengers at each bus stop.
- The number of trips will remain the same between pre- and post- optimisation to mitigate the rise in operational cost.
The model was written with Python libraries for optimisation modelling, namely IBM's Decision Optimisation CPLEX (DOcplex) and CVXPY. DOcplex is a commercial solution that was used for the initial modelling, and then translated into an open-sourced solution for cost-effectiveness. Both solutions provide a modelling language that enables the fomulation of optimisation problems, constraints, and objective functions.
Using data polled from TriMet's stream of bus service FX-2 to serve as a baseline schedule, we were able to achieve a decrease in the headway deviation of about 88%.
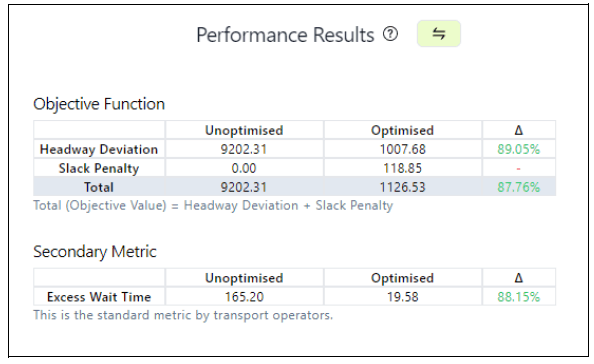
Since we have optimised the model to minimise the objective function, the objective function value will almost definitely be an improvement to the originally scheduled one, unless it was already optimal. To fairly assess this model, we can rely on the Excess Wait Time (EWT).
When comparing with the EWT, we get an excellent EWT of less than 20 seconds; around an 88% percentage decrease as well.
To ensure that the solution was not only performing well in edge cases, we also performed the same EWT comparisons between all permutable subsets of the original data of 81 trips with 42 stops each.
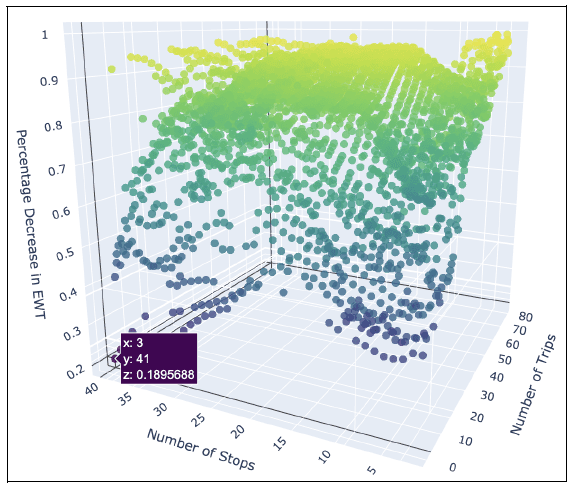
As there is no optimal substructure found in this problem (where an optimal solution can be constructed from optimal solutions of its subproblems), using subsets of the data would be equivalent to using different datasets for optimisation.
Across all permutable subsets of the dataset, the lowest percentage decrease in EWT is about 19.0% and the mean percentage decrease in EWT is 77.8%, cementing the statistical significance of the model in reducing EWT.
That marks the end of the sumamry of the project - if you wish to read more, you may access our final report and presentation which I have linked above in the introduction section!
In some ways, this project has exposed me to a full end-to-end development (less deployment) of a project, from sponsor liasing, refining requirements, scoping, planning, design, development, documentation, observability and so on. Without a doubt, the biggest scale project that I have done during my time in university.
We were lucky enough to have friendly sponsors who made communication that much easier, who also helped us as much and as quickly as possible whenever we were faced with any blockers. Definitely was a blast and an experience to remember, one I am proud to say was my Final Year Project experience 😄.
Thanks for reading once again, and this marks the end of my journey in university!